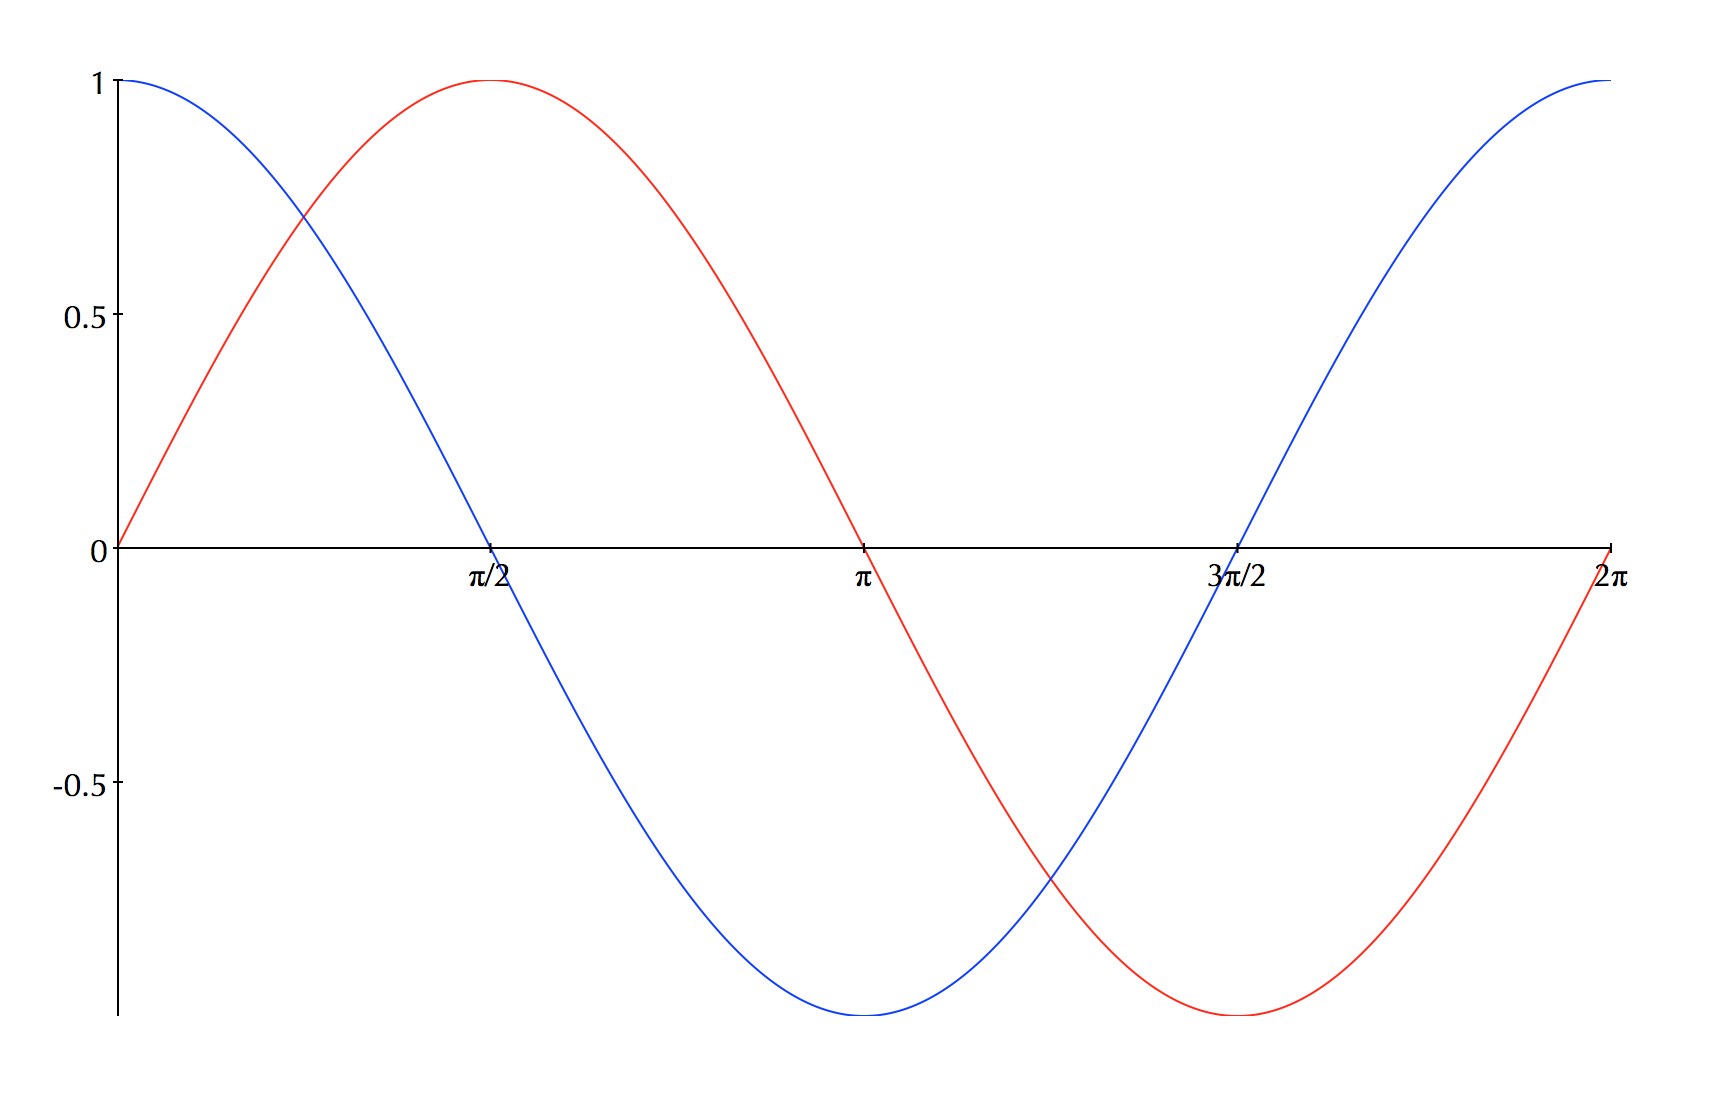
Plots made easy.
- [x] 2D line and scatter plots
- [x] Multiple axes
- [x] Custom tick marks
To start using PlotKit quickly use the plotPoints helper function. It takes a list of points and returns a view that you can use in your app:
import PlotKit

// Generate some data to plot
let count = 1024
let t = (0..<count).map({ 2*M_PI * Double($0) / Double(count-1) })
let y = t.map({ sin($0) })

// Create a PlotView
let plotView1 = plotPoints((0..<count).map{ Point(x: t[$0], y: y[$0]) }, hTicks: .fit(6), vTicks: .fit(4))You can have multiple curves or scatter plots in the same PlotView.
let plotView = PlotView()

let pointSet1 = PointSet(values: values1)
pointSet1.pointType = .disk(radius: 2)
pointSet2.pointColor = .red
pointSet1.lineColor = nil
plotView.addPointSet(pointSet1)

let pointSet2 = PointSet(values: values2)
pointSet2.pointType = .none
pointSet2.lineColor = .blue
plotView.addPointSet(pointSet2)You can customize your plot axes. You can have as many axis lines as you want on the same plot.
let plotView = PlotView()

var xaxis = Axis(orientation: .horizontal, ticks: .fit(5))
xaxis.position = .value(0)
xaxis.color = .blue
xaxis.labelAttributes = [NSForegroundColorAttributeName: NSColor.blue]
plotView.addAxis(xaxis)

var yaxis = Axis(orientation: .vertical, ticks: .distance(1))
yaxis.lineWidth = 2
plotView.addAxis(yaxis)
You can specify ticks in one of three ways:
-
fit(n): Say how many tick marks you want. PlotKit will space them evenly. -
distance(d): Say how far appart to place tick marks. -
list(l): Specify exactly the tick marks you want. This is the most flexible. You get to decide where to put the tick marks and also what their labels, line length and line thickness are.
If you want to use a PlotView in a Storyboard add an NSView and then change the class name and module like so
PlotKit is available under the MIT license. See the LICENSE file for more info.


