Exports GitHub release metrics to the Prometheus format.
./github_releases_exporterOr with docker:
docker run -p 127.0.0.1:9222:9222 caarlos0/github_releases_exporterYou can set it up on docker compose like:
version: '3'
services:
  releases:
    image: caarlos0/github_releases_exporter:v1
    restart: always
    volumes:
    - /path/to/releases.yml:/etc/releases.yml:ro
    command:
    - '--config.file=/etc/releases.yml'
    ports:
    - 127.0.0.1:9222:9222
    env_file:
    - .env
The releases.yml file should look like this:
repositories:
- goreleaser/goreleaser
- caarlos0/github_releases_exporter
On the prometheus settings, add the releases job like this:
- job_name: 'releases'
  static_configs:
  - targets: ['releases:9222']
And you are done!
You can reload the configuration at any time by sending a SIGHUP to the
process.
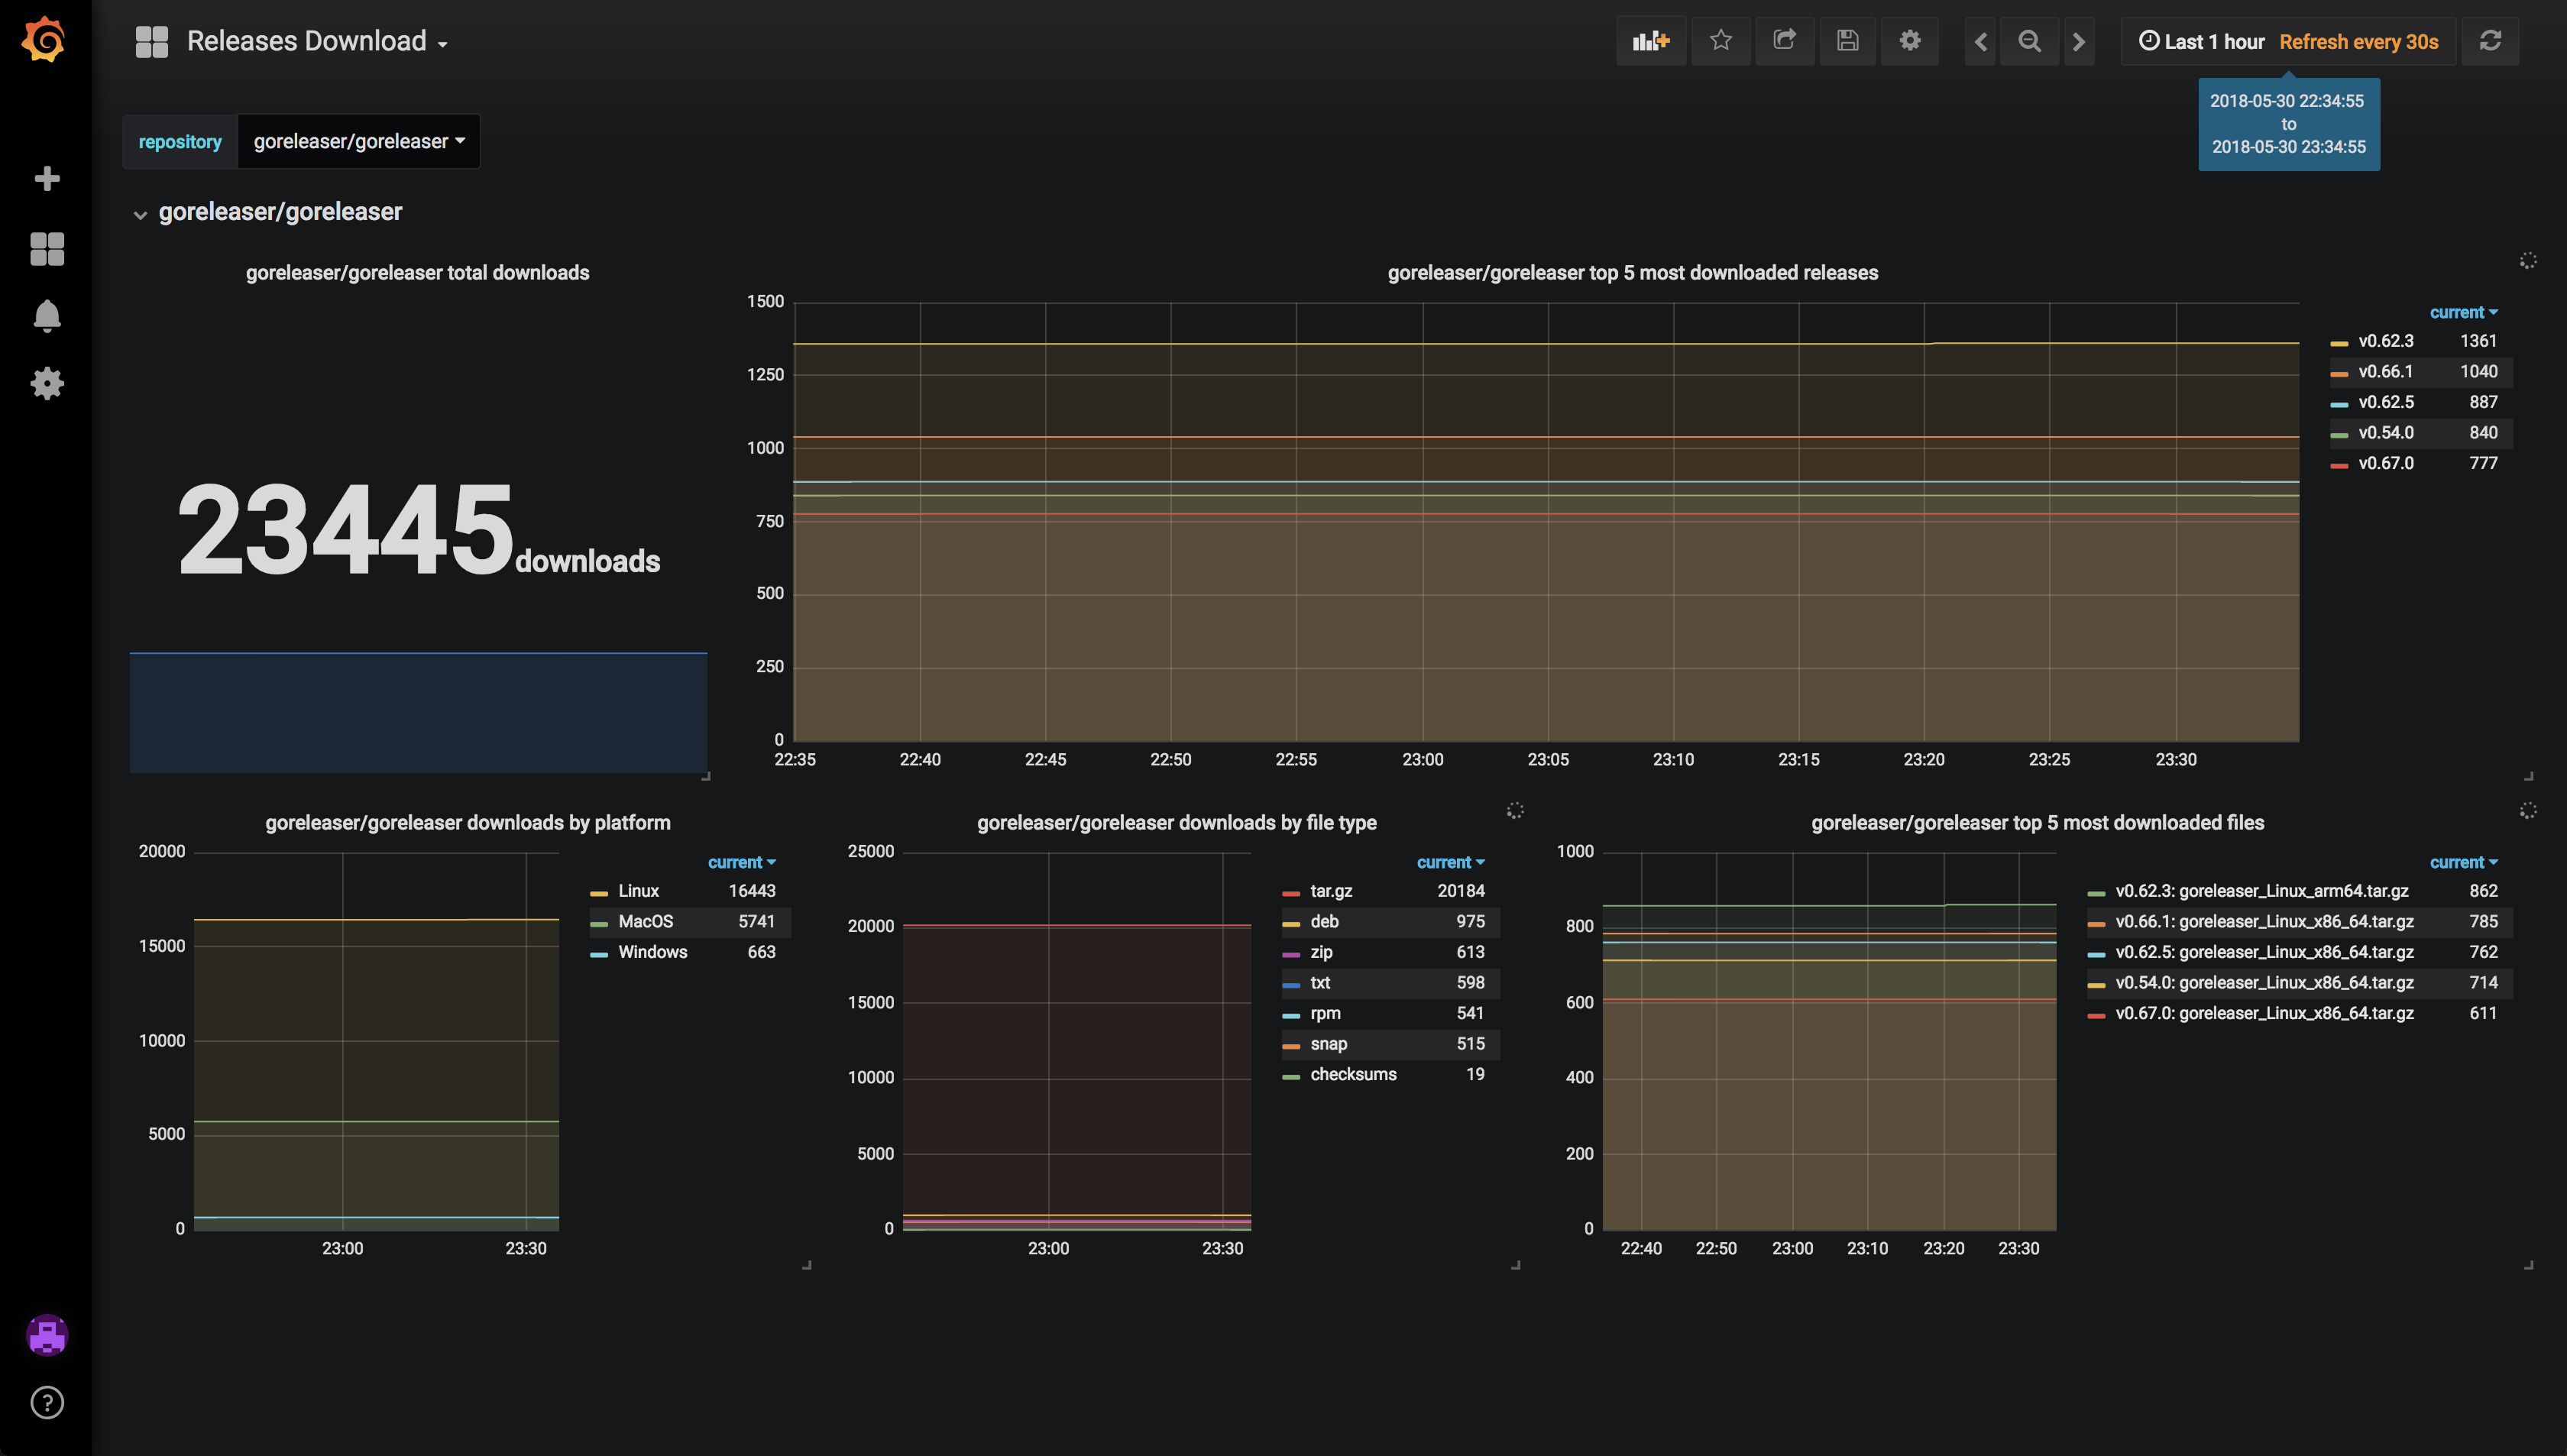
I have a dashvboard like this:
You can get it from the grafana website
or just import the dashboard 6328.
Install the needed tooling and libs:
make setupRun with:
go run main.goRun tests with:
make test


