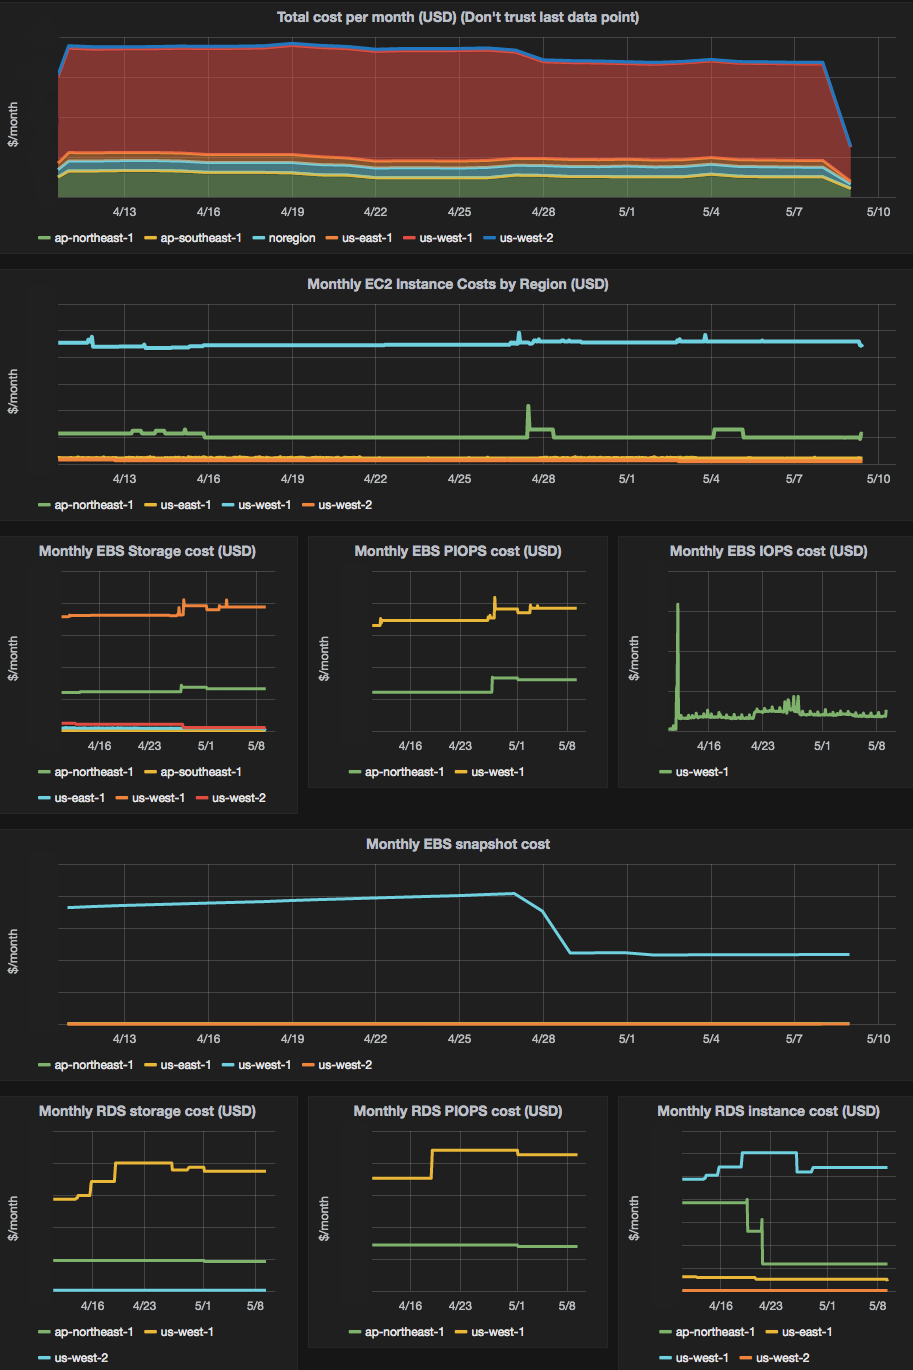
awsbill2graphite is a script that converts AWS hourly billing CSVs to Graphite metrics.
If you want to hack on it, check out DEV.md.
So far, it does the following types of metrics:
- Per-region, per-EC2-instance-type cost by the hour
- EBS metrics, including storage costs, PIOPS costs, per-million-IOPS costs, and snapshot storage costs
- Per-region RDS costs, including storage, PIOPS, and instance-hours
- ElastiCache costs per-instance-type
- Total AWS cost by the hour
More are planned.
First of all, you'll need to have hourly billing reports enabled. You can do this through the AWS billing control panel.
awsbill2graphite has some dependencies. We don't have a pip package yet (but we
have an issue for it. To
install the dependencies, go into a
virtualenv and run
pip install -r requirements.txt
The script will have to be run in that virtualenv.
In order to prevent Graphite from creating giant, mostly-zero data files, set the
following in storage-schemas.conf:
[awsbill]
priority = 256
pattern = ^awsbill\.
retentions = 1h:3650d
First set the following environment variables:
-
AWSBILL_REPORT_PATH: The path where the report lives. If downloading from S3, this should bes3://followed by the bucket name followed by the "Report path" as defined in the AWS billing control panel. If reading a local file, it should start withfile://and give the path to an hourly billing CSV file. -
AWS_ACCESS_KEY_ID: The identifier for an AWS credentials pair that will enable access to the bucket with billing reports in it. If you're using a local file instead of downloading the report from S3, you can omit this. -
AWS_SECRET_ACCESS_KEY: The secret access key that corresponds toAWS_ACCESS_KEY_ID. If you're using a local file instead of downloading the report from S3, you can omit this. -
AWSBILL_GRAPHITE_HOST: The hostname of the Graphite server to which to write metrics. If instead you want to output metrics to stdout, set this environment variable tostdout. If the Graphite port is not the default of 2003, you may append it after a colon. -
AWSBILL_METRIC_PREFIX: The prefix to use for metrics written to Graphite. If absent, metrics will begin with "awsbill.". If you set this, you should modify the[awsbill]stanza you added to Graphite'sstorage-schemas.confaccordingly.
Then run
awsbill2graphite.py
This will produce metrics named like so:
PREFIX.REGION.ec2-instance.t2-micro
PREFIX.REGION.ec2-instance.c4-2xlarge
PREFIX.REGION.ebs.snapshot
PREFIX.REGION.ebs.piops
PREFIX.REGION.rds.db-r3-xlarge
Each metric will have a data point every hour. This data point represents the total amount charged to your account for the hour previous to the data point's timestamp.
Here is a JSON description of a basic per-region-summary Grafana dashboard: grafana_dashboard.json.
A few notes:
- Snapshots are only billed once daily, so the snapshot metrics will be equal to 0 for most of their values. The value they do contain will be the cost for that entire day, not the hour.
- At the end of a month, the billing report you get will be missing most of the final day's data. That's just how AWS hourly billing reports work. Eventually (4 or 5 days after the end of the month) they give you a final report for the month, with all the data. So in the interim, you'll have a big ugly dip in your graphs.
