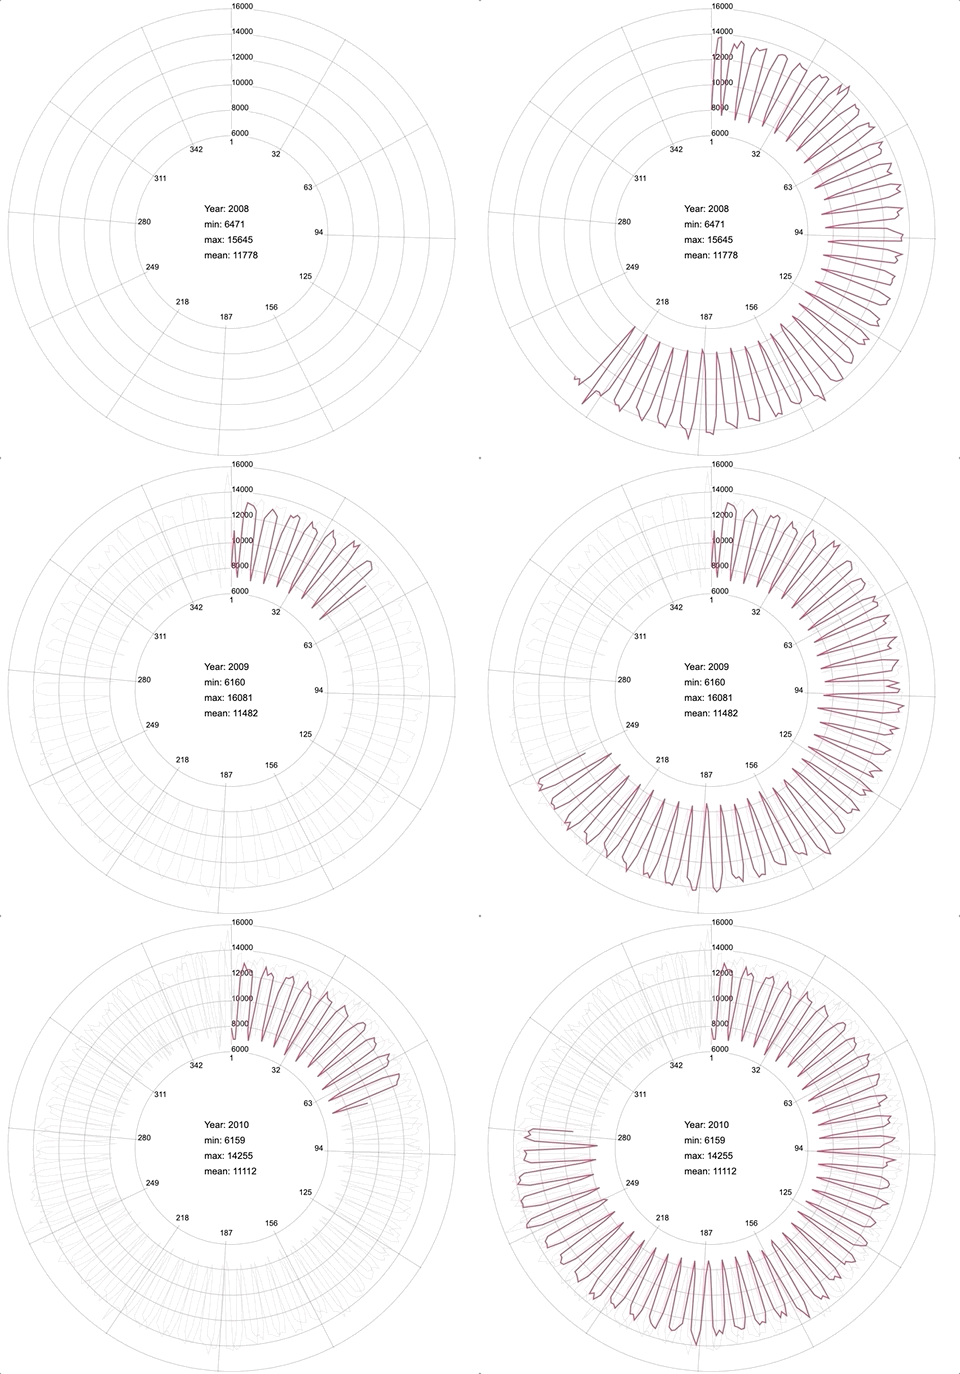
clockwork creates a cyclical, radial line charts. Cycle through years, months, days, hours, minutes, or campaigns.
You can install the released version of clockwork from GitHub with:
remotes::install_github("daranzolin/clockwork")library(tidyverse)
library(lubridate)
births <- read_csv("https://raw.githubusercontent.com/rfordatascience/tidytuesday/master/data/2018/2018-10-02/us_births_2000-2014.csv")
births <- births %>%
unite("date", date_of_month, month, year, sep = "-") %>%
mutate(date = lubridate::dmy(date),
day_of_year = yday(date),
year = year(date))
births %>%
filter(year %in% 2008:2014) %>%
clockwork(x = day_of_year,
y = births,
cycle = year,
cycle_label = "Year: ",
show_cycle_stats = TRUE,
x_ticks = 12) Control loop duration, stroke line colors/opacity, and font size/family with the cw_style function.
