This repo is a collection of vm statistics, gathered from a geth instance.
Every data point represents 10k blocks. Every time an opcode executed, a timer was stopped, the time since start was noted, and
the new opcode timer was started. After 10K blocks, the data was dumped into a json file. The files are available in the /m5.2xlarge/-folder.
The benchmarks are from a m5.2xlarge aws instance that did a full-sync.
Such a machine has
-
8 vcpu, 32 Gb RAM-
300 GB NVMe SSD.
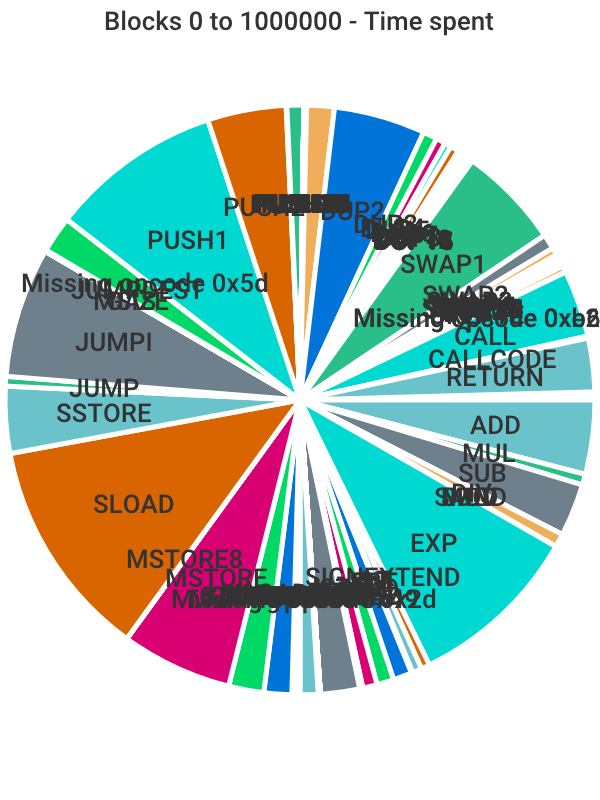
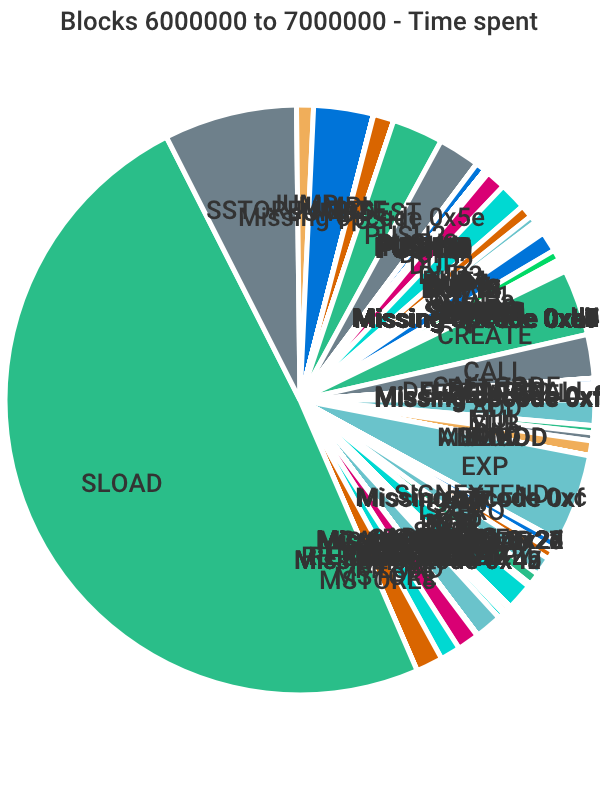
The large thing there is SLOAD.
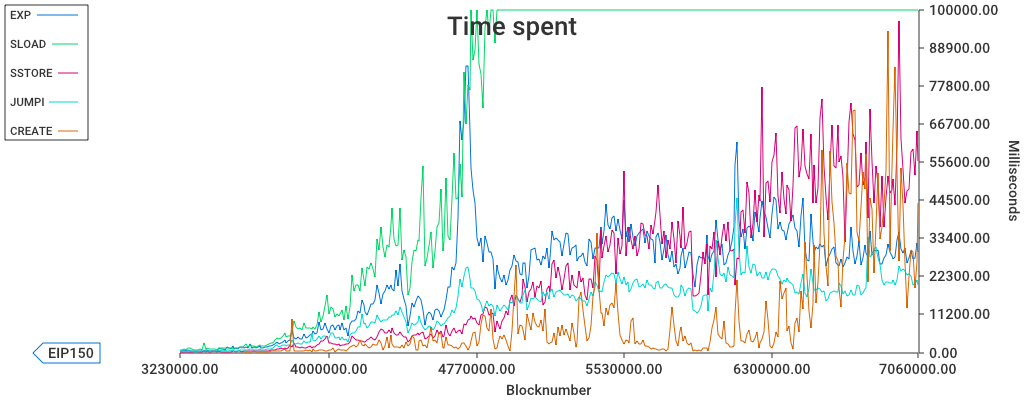
If we place a cap on it, and filter so we only see the top four things that take up the execution time, we can see that the top ones are
-
SLOAD, obviously, -
SSTORE- hardly surprising. Even thoughSSTOREis expensive, it's also one that touches disk. EXP-
JUMPI- This is a very common opcode. Also, Geth nowadays defer the jump analysis until it's actually needed - the first time aJUMP/JUMPIis called.
It seems that aside from SLOAD, there's no other single operation that dominates the remaining time that
is spent on block processing.
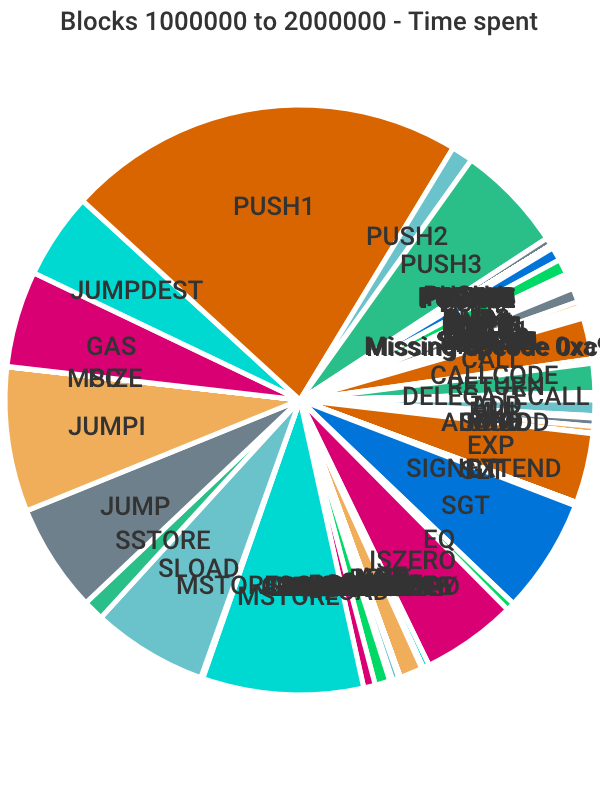
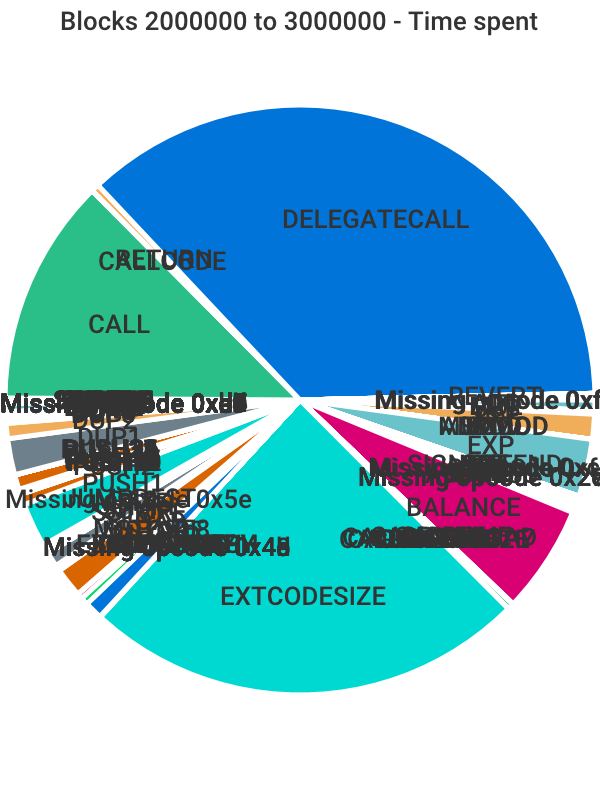
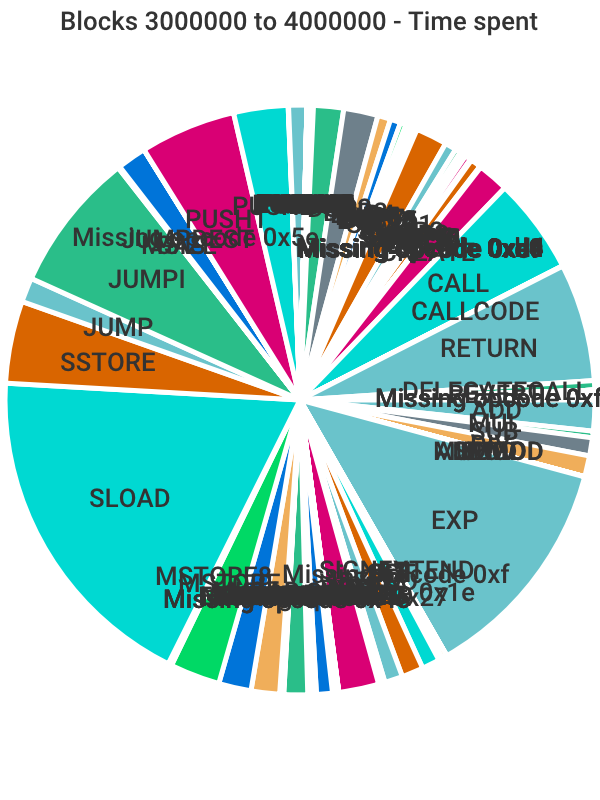
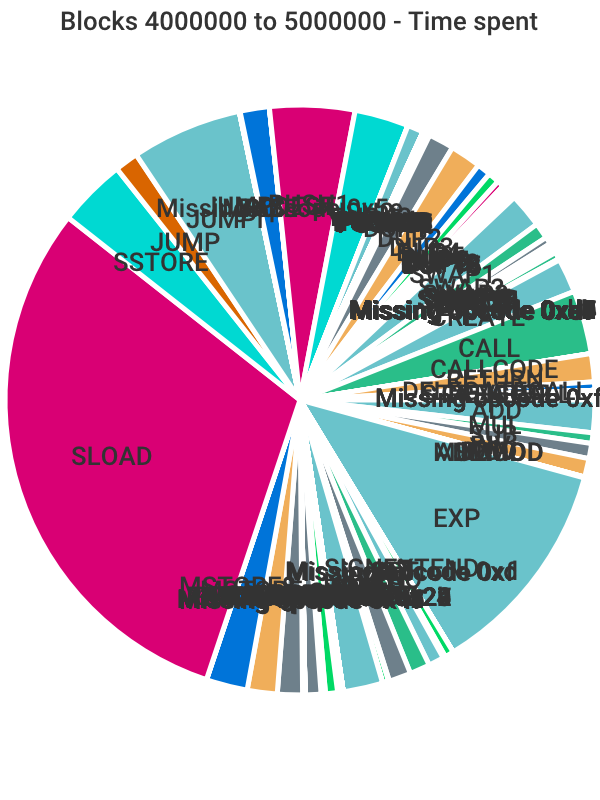
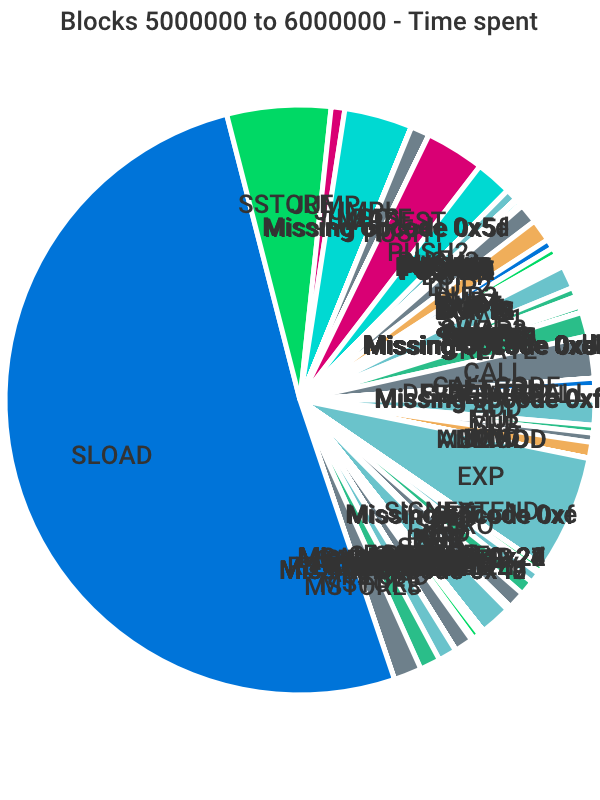
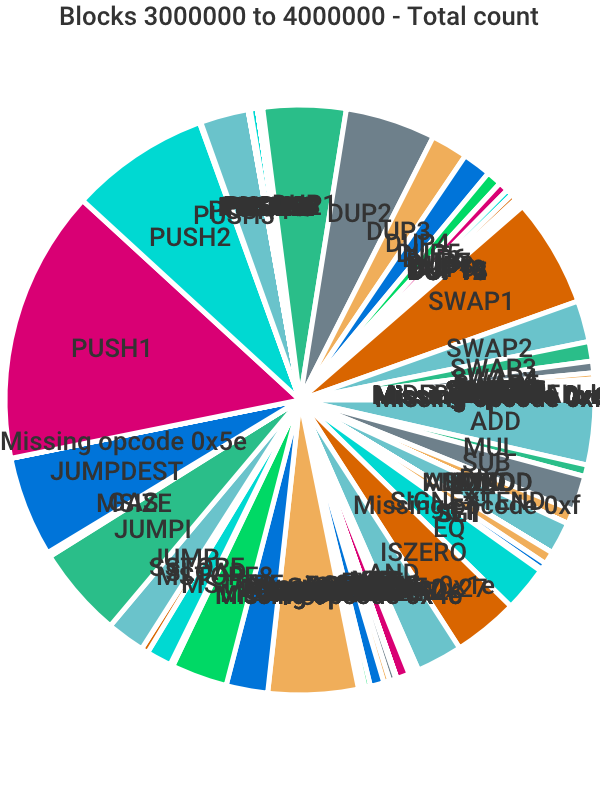
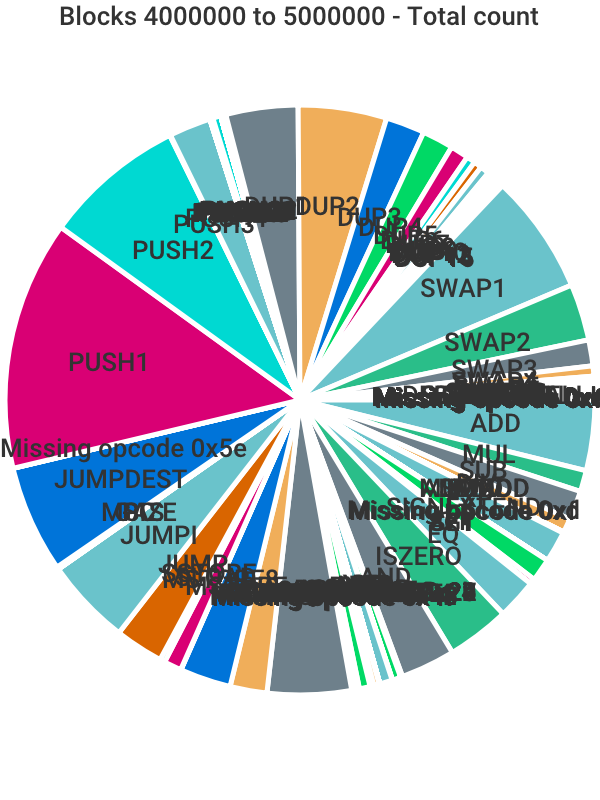
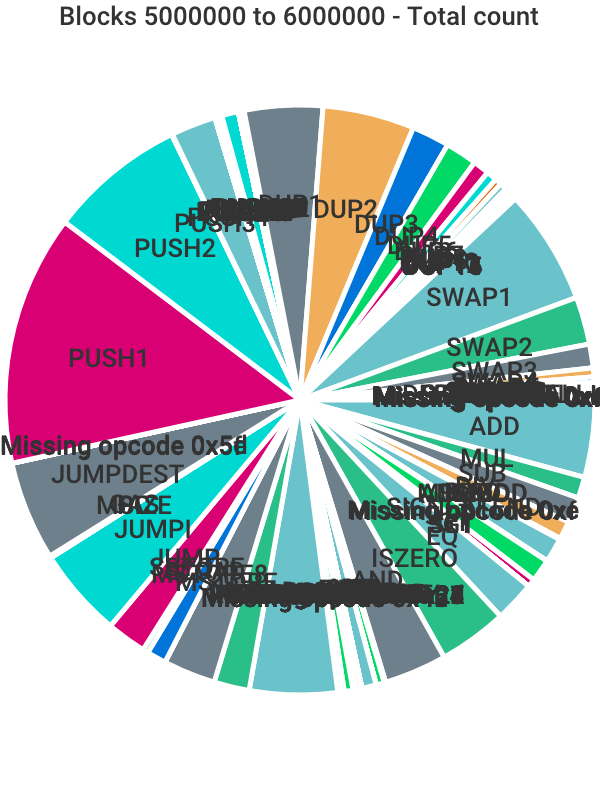
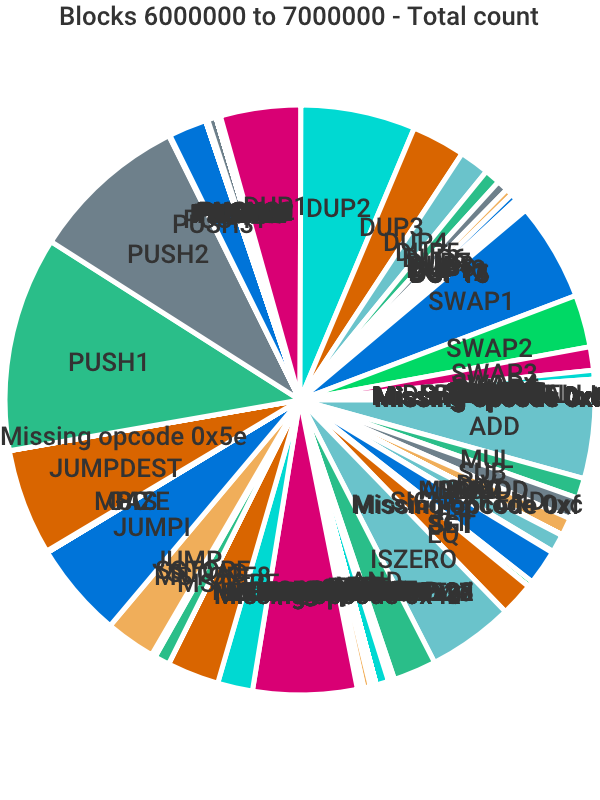
Let's see how the time spent has progressed through time.
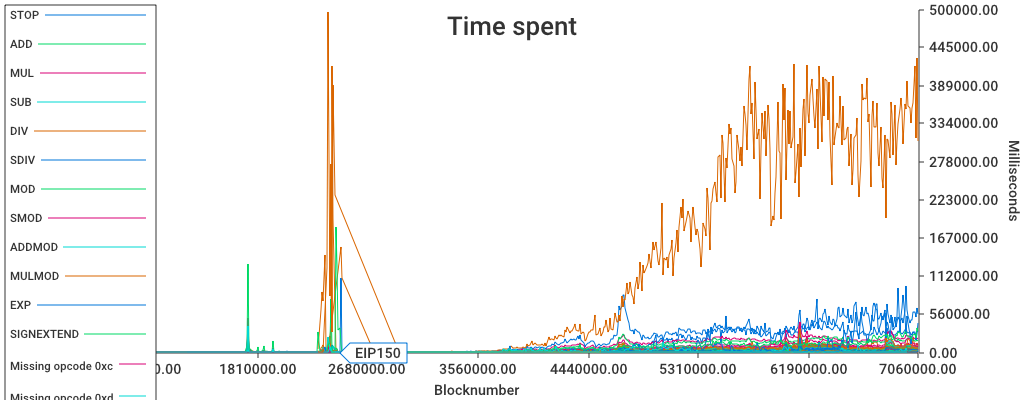
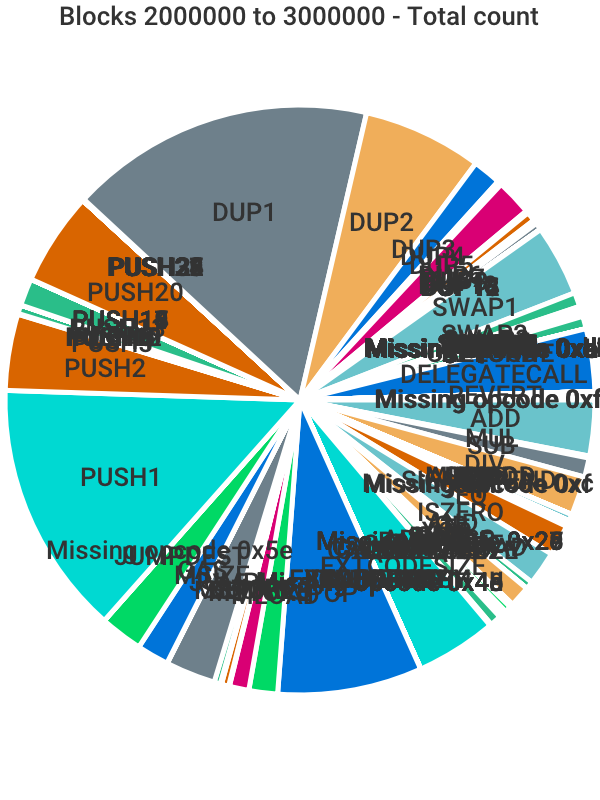
The 2-3M range contains the shanghai attacks.
In the 3M-4M range, we start seeing SLOAD take a larger piece of the pie.
... and accounting for ~50% between 5M and 6M.
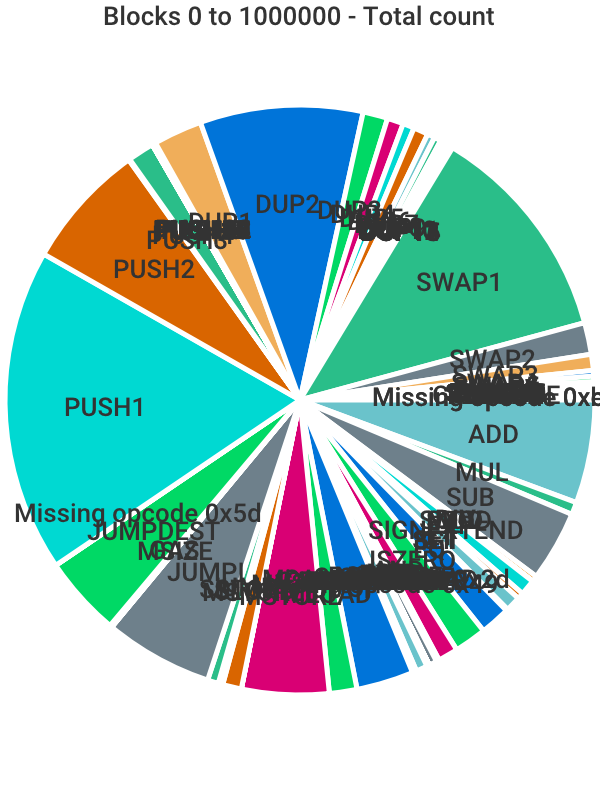
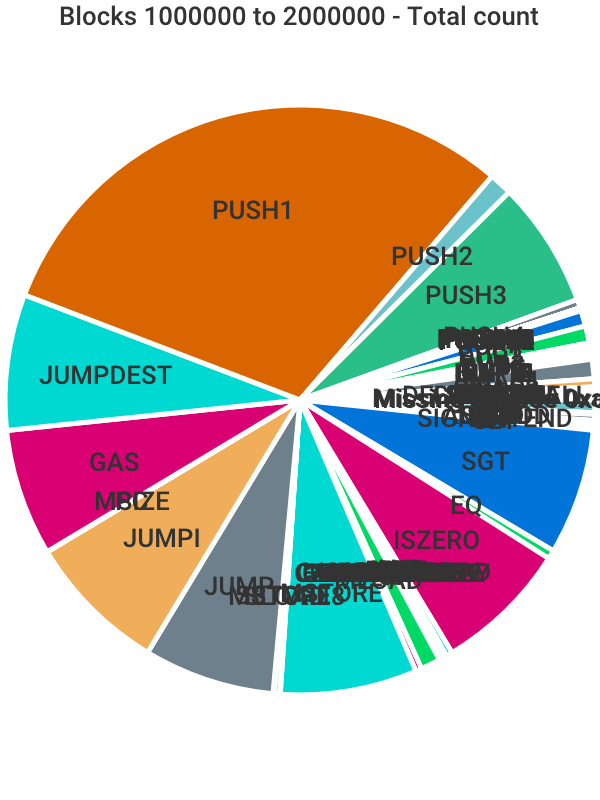
We can also look at the prevalence of opcodes -- that is, how common is an opcode, and how has that varied over time?
Are operations well-balanced, gas-wise?
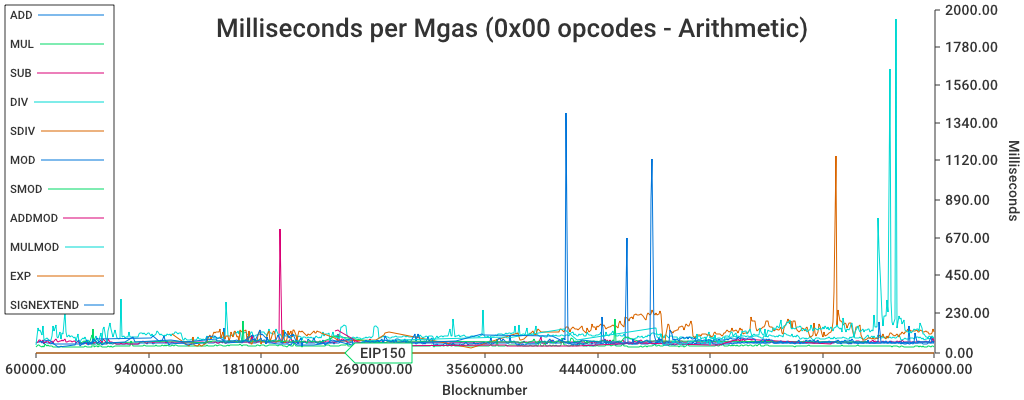
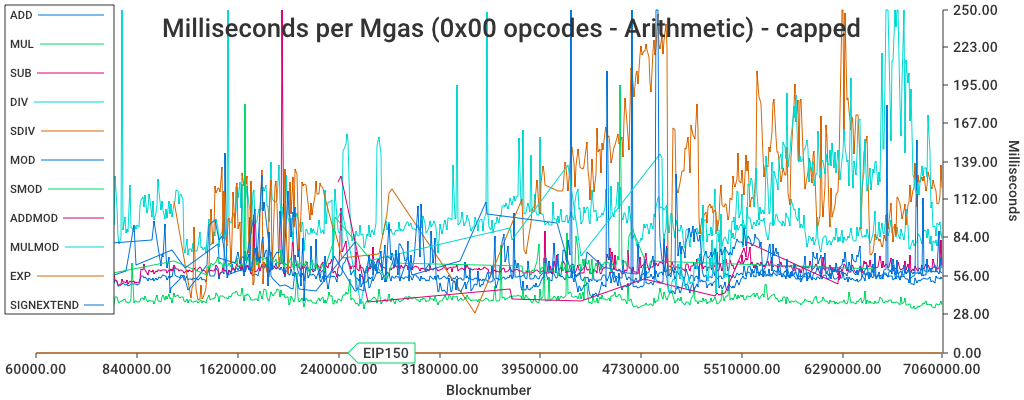
The arithmetic ops seems to vary within one order of magnitude -- some peaks which is likely due to noisy data.
Here's a graph where it's been capped at 250
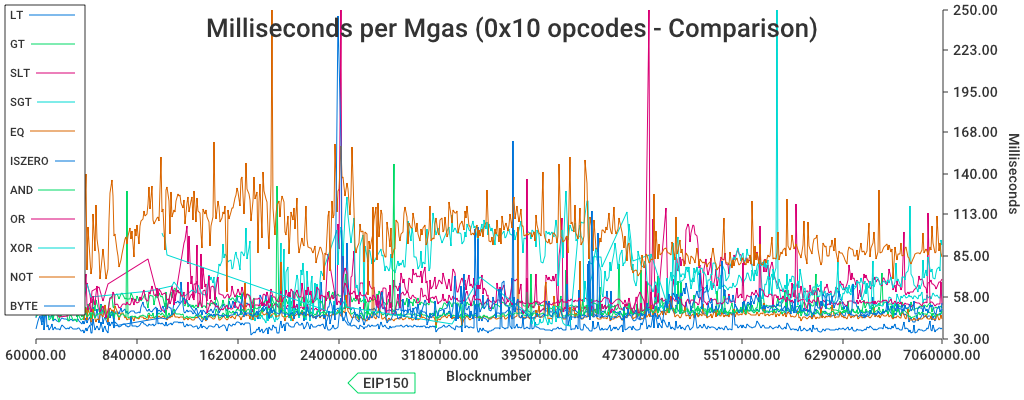
The comparisons ops (also capped at 250) are fairly aligned within 35 and 130. The NOT looks pretty over-represented.
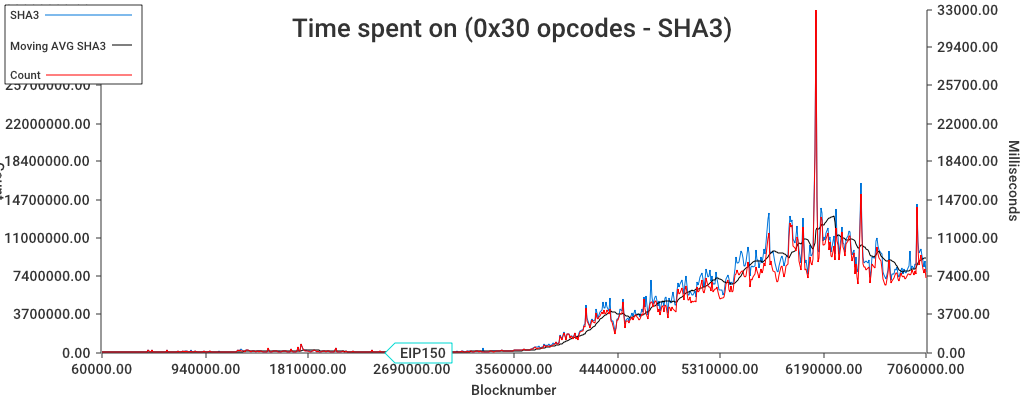
The SHA3 operation has it's own range. Since it'a dynamically priced operation, the gas has not been part of the data collection.
What we can do, however, is plot the time spent during SHA3, and the number of invocations.
The two line up pretty well, so the op doesn't 'degrade' over time. As expected.
The following ops have dynamic gas, and are not charted:
CALLDATALOAD,
CALLDATACOPY,
CODECOPY,
EXTCODECOPY,
RETURNDATACOPY,
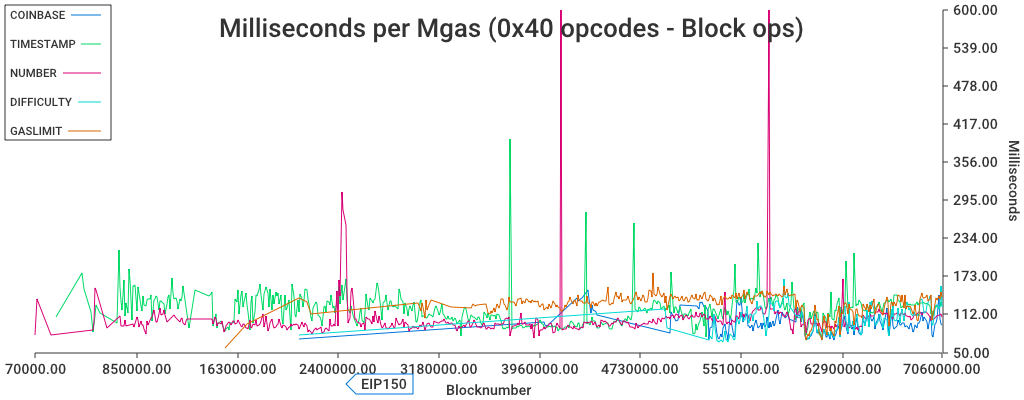
Here are the remainders (split up into two charts, both capped at 500):
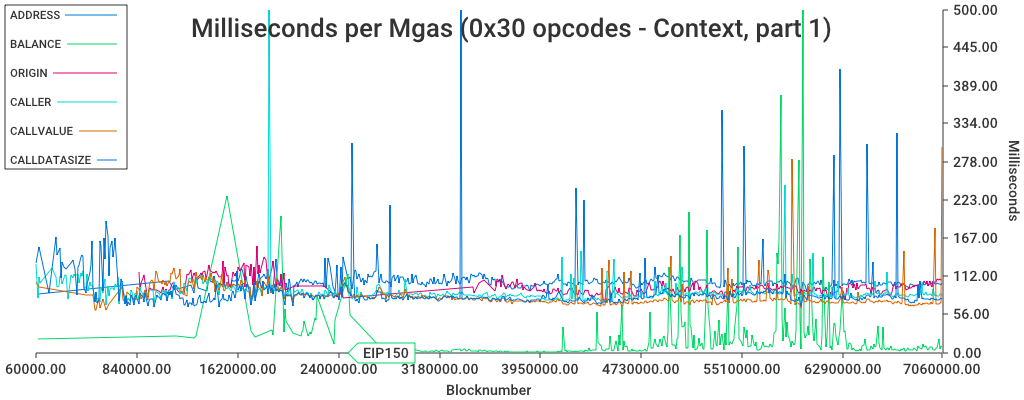 The big spike around
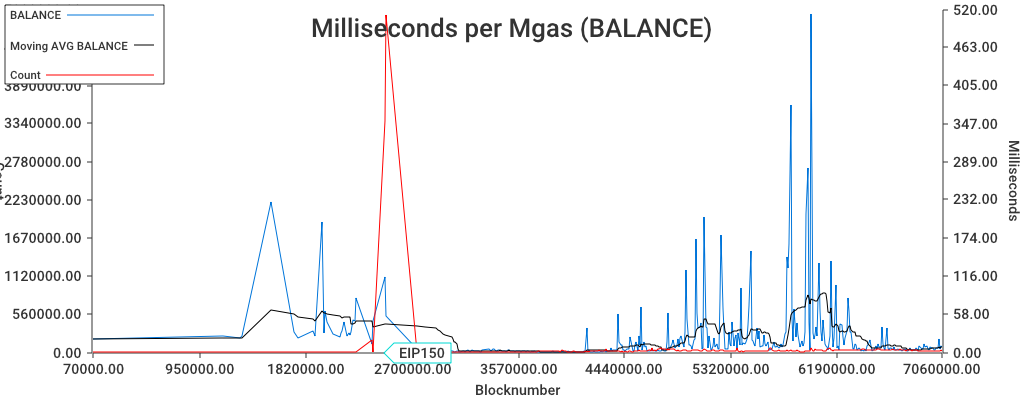
 2.08M is, surprisingly, CALLER. Aside from a few spikes, they're fairly well aligned -- except for BALANCE, which is starting to
fluctuate and reaching high peaks. It was repriced in EIP150, anad was low for a few million blocks.
Note: BALANCE should really be called EXTBALANCE, since it fetches balance for (potentially) external accounts.
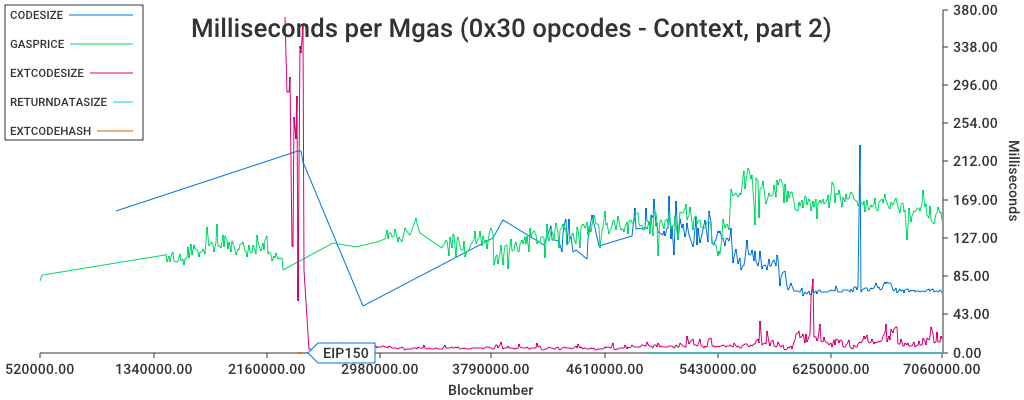
The EXTCODESIZE looks extremely cheap -- which makes sense, since it was repriced at
block 2463000 from 20 to 700.
The Tangerine Whistle HF also contained these changes:
- Increase the gas cost of
EXTCODESIZEto700(from20). - Increase the base gas cost of
EXTCODECOPYto700(from20). - Increase the gas cost of
BALANCEto400(from20). - Increase the gas cost of
SLOADto200(from50). - Increase the gas cost of
CALL,DELEGATECALL,CALLCODEto700(from40). - Increase the gas cost of
SELFDESTRUCTto 5000 (from0).
This chart capped at 600.
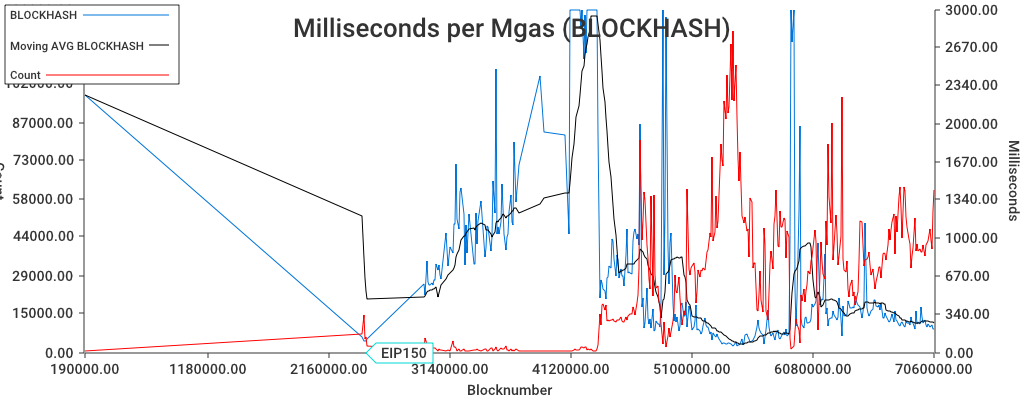
Missing from this chart is BLOCKHASH, which deserves it's own chart. It's plotted along with it's opcode count --
this operation is a bit quirky, and is more expensive when it's executed in isolation. So the more this op is used, the
cheaper the operations become (to a degree).
This chart capped at 3000.
There are some further optimizations that can be done on this op, at least for geth.
These are the ops
POP
MLOAD
MSTORE
MSTORE8
SLOAD
SSTORE
JUMP
JUMPI
PC
MSIZE
GAS
JUMPDEST
However,
-MSTORE and MSTORE8 have an additional cost for expanding memory
-
SLOADvaries depending on previous value -
JUMP/JUMPIhave a hidden cost: they require jumpdest analysis.
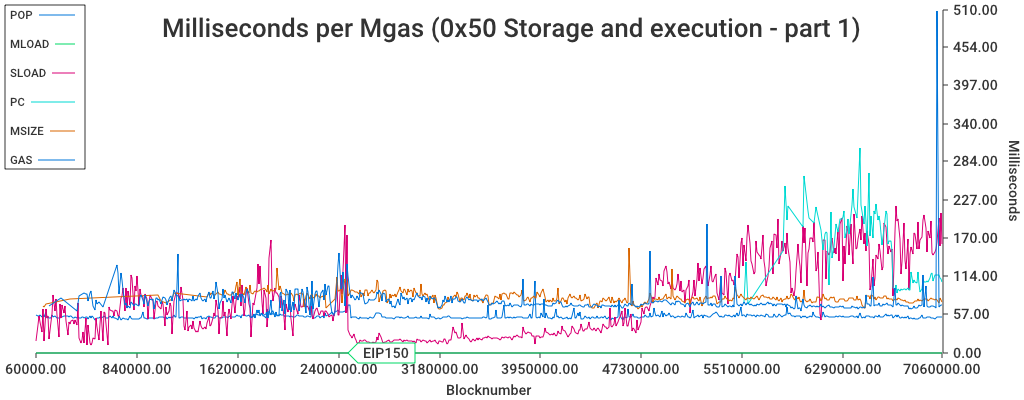
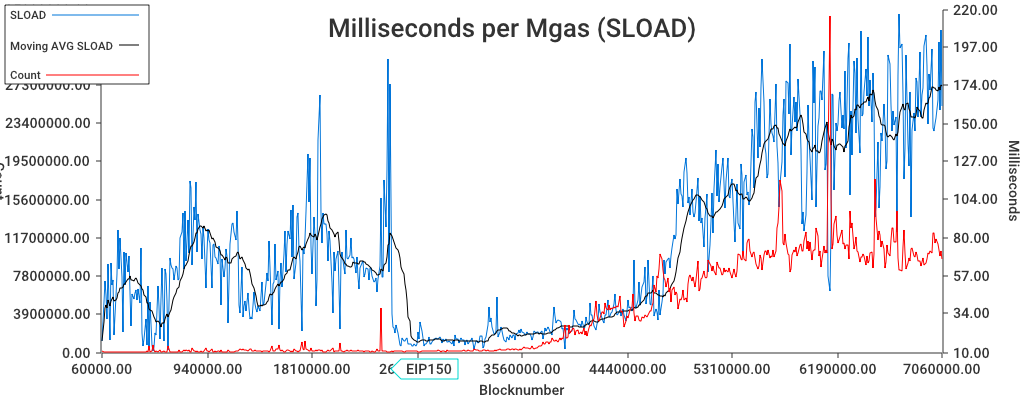
So the first graph here shows POP, MLOAD, SLOAD,PC, MSIZE and GAS,
It's clear that SLOAD went down at EIP150, but has started to rise significantly since then. At around 5M, it was back
to the same levels as before EIP150.
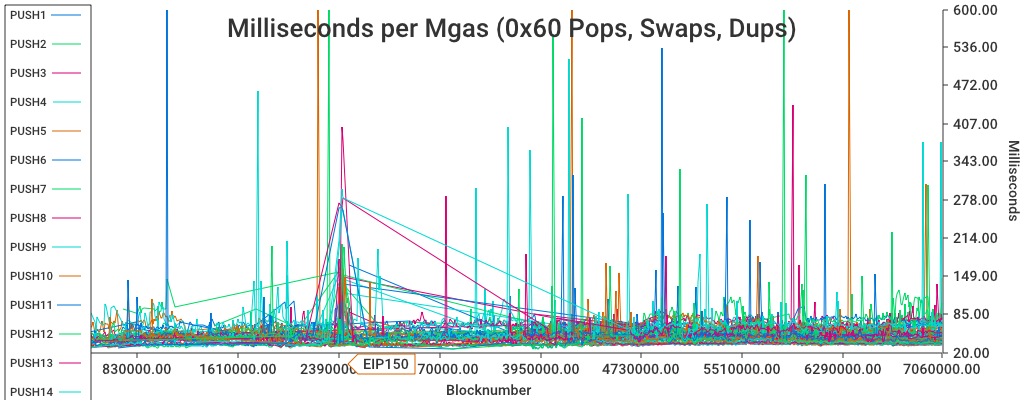
These are DUPX,SWAPX and PUSHX. Here capped for spikes, at 600:
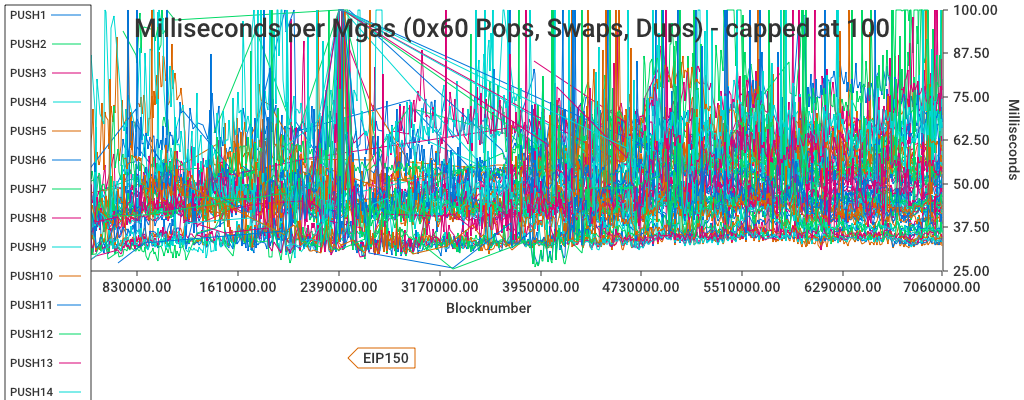
Here capped at 100:
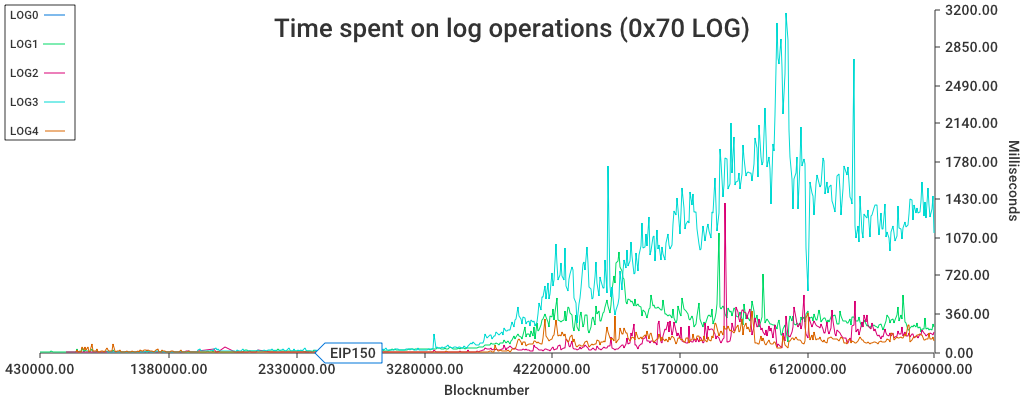
The LOG opcodes are dynamically priced, depending on the memory size, so we don't have gas/time charts, but here's a
time spent-chart:
Remaining ops are 'special' - both dynamic costs and non-trivial effects, such as starting new call contexts or exiting from call contexts.
CREATE
CALL
CALLCODE
RETURN
DELEGATECALL
CREATE2
STATICCALL
REVERT
SELFDESTRUCT
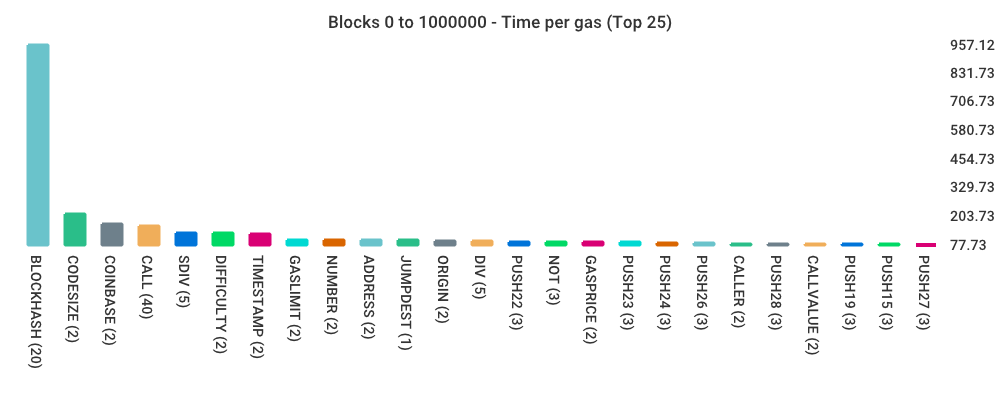
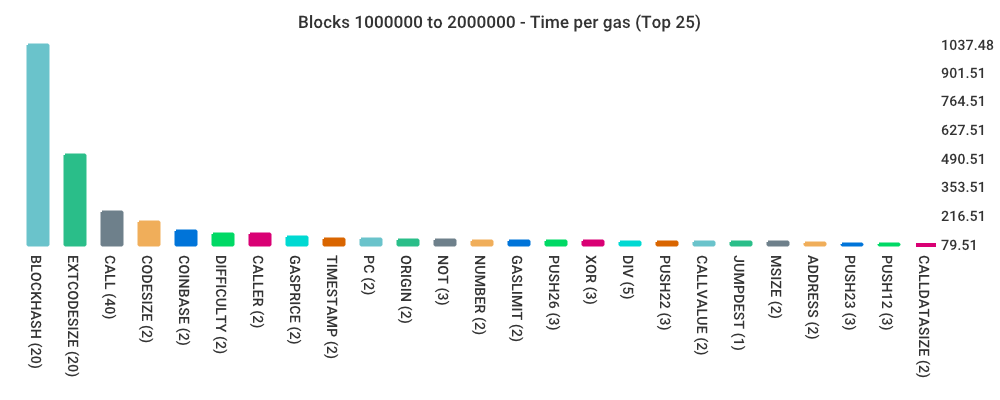
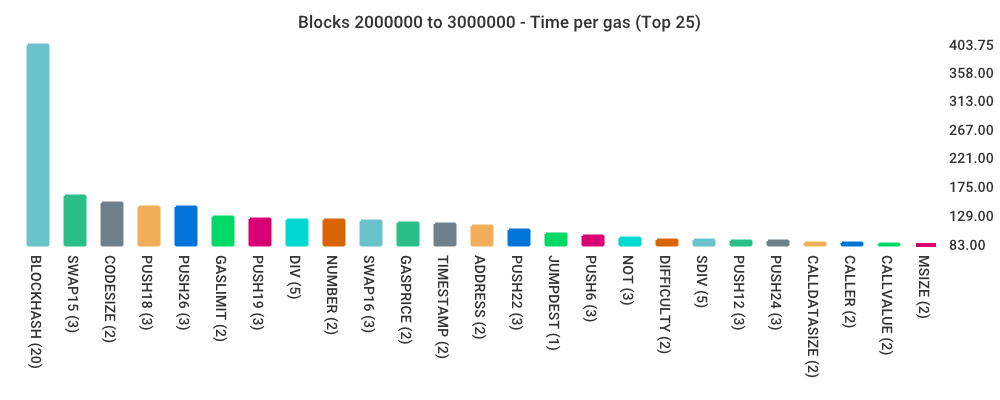
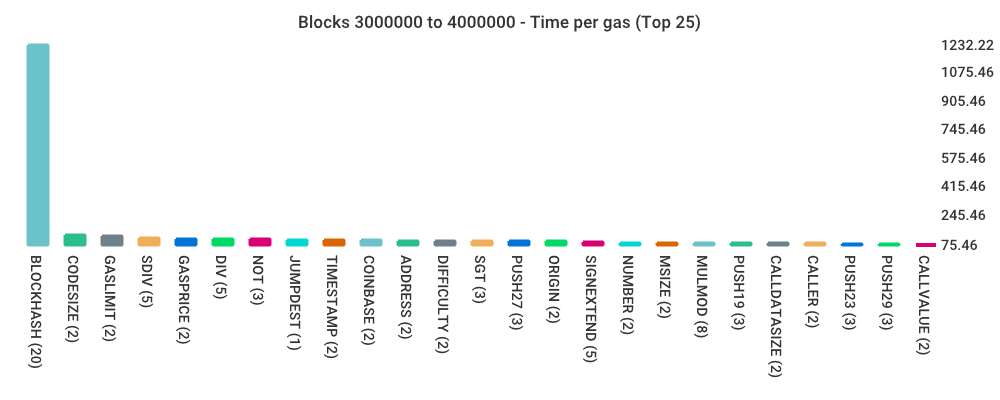
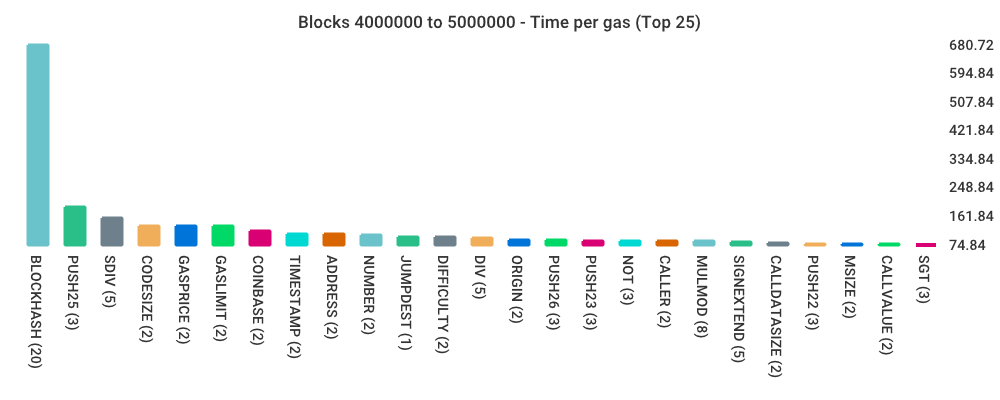
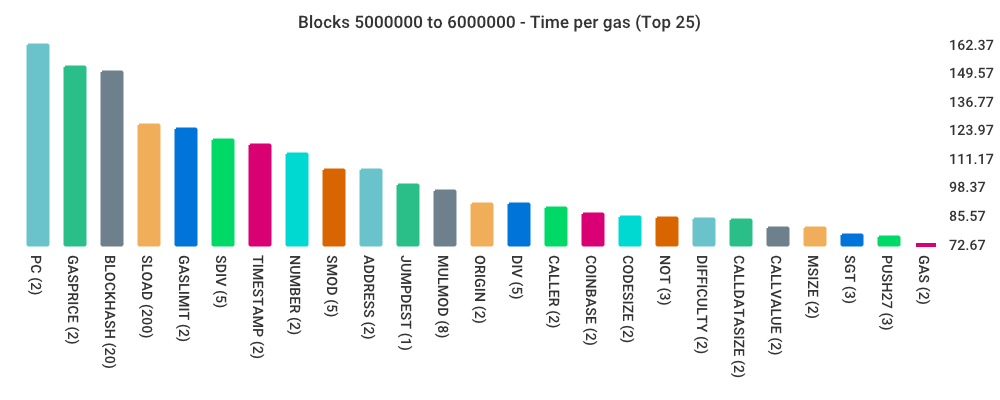
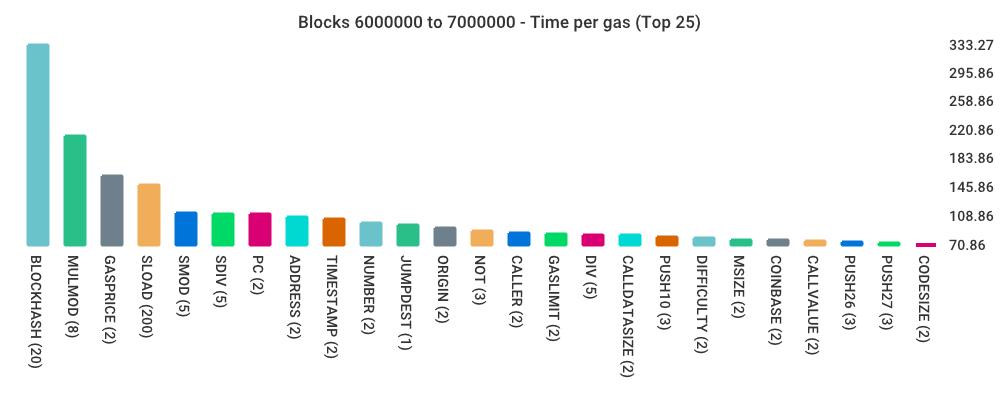
If 'heavy' means large time per gas unit. Here are some charts, where you can also
see the actual cost. For the really cheap opcodes, like PC, those are probably
over-represented, since they are so brief that the actual execution is in roughly on the same
order of magnitude as actually performing the measurement.
Anyway, some graphs:
