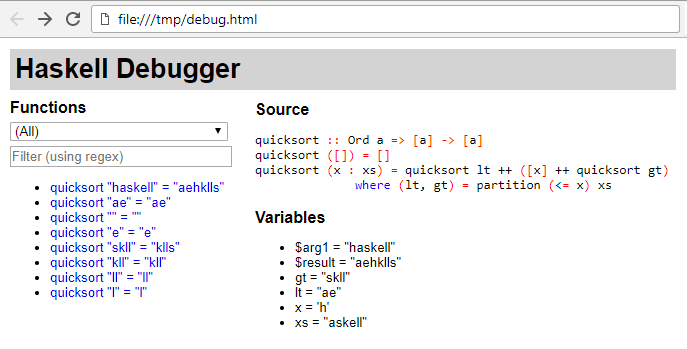
A library for debugging Haskell programs. To use, take the functions that you are interested in debugging, e.g.:
module QuickSort(quicksort) where
import Data.List

quicksort :: Ord a => [a] -> [a]
quicksort [] = []
quicksort (x:xs) = quicksort lt ++ [x] ++ quicksort gt
    where (lt, gt) = partition (<= x) xs
Turn on the TemplateHaskell, ViewPatterns and PartialTypeSignatures extensions, import Debug, indent your code and place it under a call to debug, e.g.:
{-# LANGUAGE TemplateHaskell, ViewPatterns, PartialTypeSignatures #-}
{-# OPTIONS_GHC -Wno-partial-type-signatures #-}
module QuickSort(quicksort) where
import Data.List
import Debug

debug [d|
   quicksort :: Ord a => [a] -> [a]
   quicksort [] = []
   quicksort (x:xs) = quicksort lt ++ [x] ++ quicksort gt
       where (lt, gt) = partition (<= x) xs
   |]
We can now run our debugger with:
$ ghci QuickSort.hs
GHCi, version 8.2.1: http://www.haskell.org/ghc/  :? for help
[1 of 1] Compiling QuickSort        ( QuickSort.hs, interpreted )
Ok, 1 module loaded.
*QuickSort> quicksort "haskell"
"aehklls"
*QuickSort> debugView
The call to debugView starts a web browser to view the recorded information, looking something like:
You can look and play with the example results for various examples:
-
quicksort "haskell"as above. -
quicksortBy (<) "haskell", likequicksortbut using a comparison function and including a trace ofpartitionitself. -
lcm_gcd 6 15, computinglcm 6 15 ^^ gcd 6 15.
debug-pp is a Haskell source preprocessor for streamlining the debug instrumentation of a module or a package. It performs the steps described above automatically. That is:
- append an import for the
Debugmodule, - wrap the body in a
debugsplice using a TH declaration quasiquote, and - add the required GHC extensions.
To instrument a module, add the following pragma to the top of the file:
{-# OPTIONS -F -pgmF debug-pp #-}To instrument an entire program, add the following line to your stack descriptor, or if you don't use stack, to your cabal descriptor:
ghc-options: -F -pgmF debug-ppIn both cases you will also need to modify your Cabal descriptor in order to
- add a dependency on the
debugpackage - (optional) add a build tool depends on
debug-pp(required Cabal 2.0) :
Library
  ...
build-tool-depends: debug-pp:debug-ppdebug-pp tries to find a config file in the following locations (from higher to lower precedence):
-
.debug-pp.yamlin the current directory (useful for per-directory settings) -
.debug-pp.yamlin the nearest ancestor directory (useful for per-project settings) -
debug-pp/config.yamlin the platform’s configuration directory (on Windows, it is %APPDATA%, elsewhere it defaults to~/.configand can be overridden by theXDG_CONFIG_HOMEenvironment variable; useful for user-wide settings) -
.debug-pp.yamlin your home directory (useful for user-wide settings) - The default settings.
Use debug-pp --defaults > .debug-pp.yaml to dump a
well-documented default configuration to a file, this way you can get started
quickly.
The configuration options include:
- Exclude modules by name.
- Instrument the
mainfunction withdebugRun. - Choice of backend.
- In the case of the
Hoedbackend, whether to enable the automatic deriving ofGenericandObservableinstances.
This package offers two alternative backends for generating the debug trace:
-
import DebugThis is the default backend, which relies on
Showinstances to observe values strictly. If your program relies on laziness, it will probably crash or loop. -
import Debug.HoedA new experimental backend built on top of Hoed. Requires GHC 8.2 or higher
Fully lazy, able to observe function values and provide call stacks: example. The instrumentation is simpler, so it is known to work in more cases. It relies on
Observableinstances which are derivable (the TH wrapper can take care of this automatically). Note that it will probably not work in multi threaded environments yet.
- Polymorphic functions must have type signatures, otherwise GHC will fail to infer an unambiguous type when annotated for debugging.
- Types under observation must have
Show(orObservable) instances, otherwise they will fall back to the default<?>. - Calling the debugged function inside GHCi records the results for viewing inside the UI.
The function can be called multiple times with different parameters, and the results of each individual run can be selected inside the UI.
- You can create multiple
debug [d|...]blocks inside a module and you can also put more than one function inside a single block.
A function being debugged can refer to another function also being debugged, but due to a limitation of Template Haskell, the definition of the function being called must occur above the point of its reference in the source module.
Due to constant applicative forms (CAFs) distorting the debug trace, it is not advisable to run the debugger twice in the same GHCi session.
This tool is quite new, so it has both limitations, places it is incomplete and bugs. Please report all the issues you find and help us make it better.
For practical alternatives for debugging Haskell programs you may wish to consider:
- GHCi debugger, simple imperative-style debugger in which you can stop a running computation in order to examine the values of variables. The debugger is integrated into GHCi. Robust, reliable, somewhat difficult to use.
- Hood and Hoed, a value-based observational debugger with a difficult user interface, deals well with laziness.
- Hat, good ideas, but I've never got it working.
Compared to the above, debug stresses simplicity of integration and user experience.
A: If you get wine: invalid directory "/home/f/.wine" in WINEPREFIX: not an absolute path when running debugView that means xdg-open is handled by Wine. Fix that and it will work once more.
A: Explicitly load the Debug module in GHCi via :m + Debug


