A Pipeline for Smart Devices
Presentation: https://iot.rquitales.com/slides/
As the prices of electronical components and sensors get cheaper over time, more and more internet enabled smart devices are popping up. An effective way to generate data on mass with these cheap devices is to incorporate citizen science. Citizen science projects can generate high velocity of data that can require extensive processing due to the computing processors on board these devices being weak and cheap.
Currently, there are around 200 ongoing citizen science projects. As the interest in cheap devices and DIY kits available is increasing, the number of citizen science projects is also expected to grow.
This pipeline is using data from Safecast, who are conducting a citizen science experiement in Japan. Smart sensors in Japan have been collection radiation data since the 2012 Fukushima Nuclear Incident.
The data is ~13 GB in size. I will be using a subset of this data source to simulate a streaming pipeline.
The data source is rectangular, and contains the folllowing fields: time: Time stamp of sensor measurement latitude: Latitude of sensor longitude: Longitude of sensor cpm: Uncalibrated sensor reading of the radiation level, given in counts per minute (CPM).
Air quality data is simulated for this purpose. Instead of reporting CPM, it reports in electrical signal (millivolts, mV). This is then to be calibrated by the pipeline.
20,000 homes are simulated as well within Japan where they could have at least one of the two sensors.
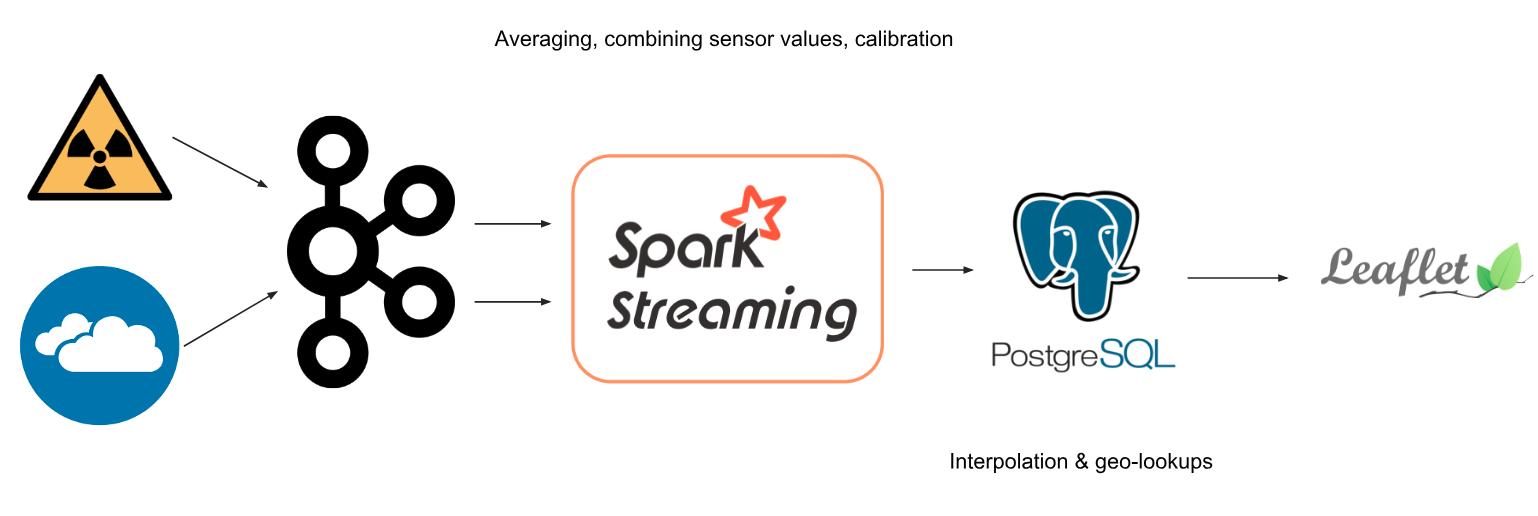
- Raw data is utilised as seed files for the Kafka producer
- Kafka ingests the radiation and air quality data as two separate topics
- Spark Streaming processes the data
- The results are stored in PostgreSQL with the PostGIS extension
- UI is powered by leaflet for mapping visualisations and powered by PHP and Javascript
The bulk of the data processing occurs within Spark Streaming. For each device/sensor, Spark Streaming collects up to 60 seconds of data for it and computes its average. This is done to reduce noise in the sensor's reading, since they are cheap and can produce highly variable instantaneous readings. Both the averaged air quality and radiation data are then calibrated into meaningful units. As per other chemical sensors, the linear range of a sensor is always used for quantification purposes, hence, the calibration done within Spark Streaming is a linear mapping from the raw units to meaningful radiation (µSv/h) and air quality (µg/m3) units. The two sensor data are then merged using their "home" ids.
The processed streaming data is then stored into PostgreSQL with the PostGIS extension. This allows for spatial calculations. Interpolation of sensor data from faulty units, or from homes that don't have one particular type of sensor is carried out, based on sensors from surrounding areas (within a 10 km range).
The frontend is developed using PHP as the backend and leaflet as the main visualisation framework. This allows displaying a heatmap, while also enabling a search bar powered by spatial SQL queries.
Resource provisioning and cluster installation were done using Pegasus, a tool developed by Insight. All instances were running Ubuntu 16.04.5 LTS at the time they were created.
peg up kafka-cluster with 1 master, 4 workers
peg install spark-cluster [ssh, environment, aws, zookeeper, kafka, kafka-manager]
peg service spark-cluster zookeeper start
peg service spark-cluster kafka start
peg service spark-cluster kafka-manager start
peg up spark-cluster with 1 master, 4 workers
peg install spark-cluster [ssh, environment, aws, hadoop, spark]
peg service spark-cluster hadoop start
peg service spark-cluster spark start
peg up frontend-cluster with 1 instance
peg install frontend-cluster [ssh, aws, environment]
peg ssh frontend-cluster 1 'sudo apt install postgresql nginx php7.0'
